Fitxer:2014 militrary expenditures absolute.svg

Mida d'aquesta previsualització PNG del fitxer SVG: 512 × 288 píxels. Altres resolucions: 320 × 180 píxels | 640 × 360 píxels | 1.024 × 576 píxels | 1.280 × 720 píxels | 2.560 × 1.440 píxels.
Fitxer original (fitxer SVG, nominalment 512 × 288 píxels, mida del fitxer: 1,52 Mo)
| Aquest fitxer i la informació mostrada a continuació provenen del dipòsit multimèdia lliure Wikimedia Commons. |
Resum
| Descripció |
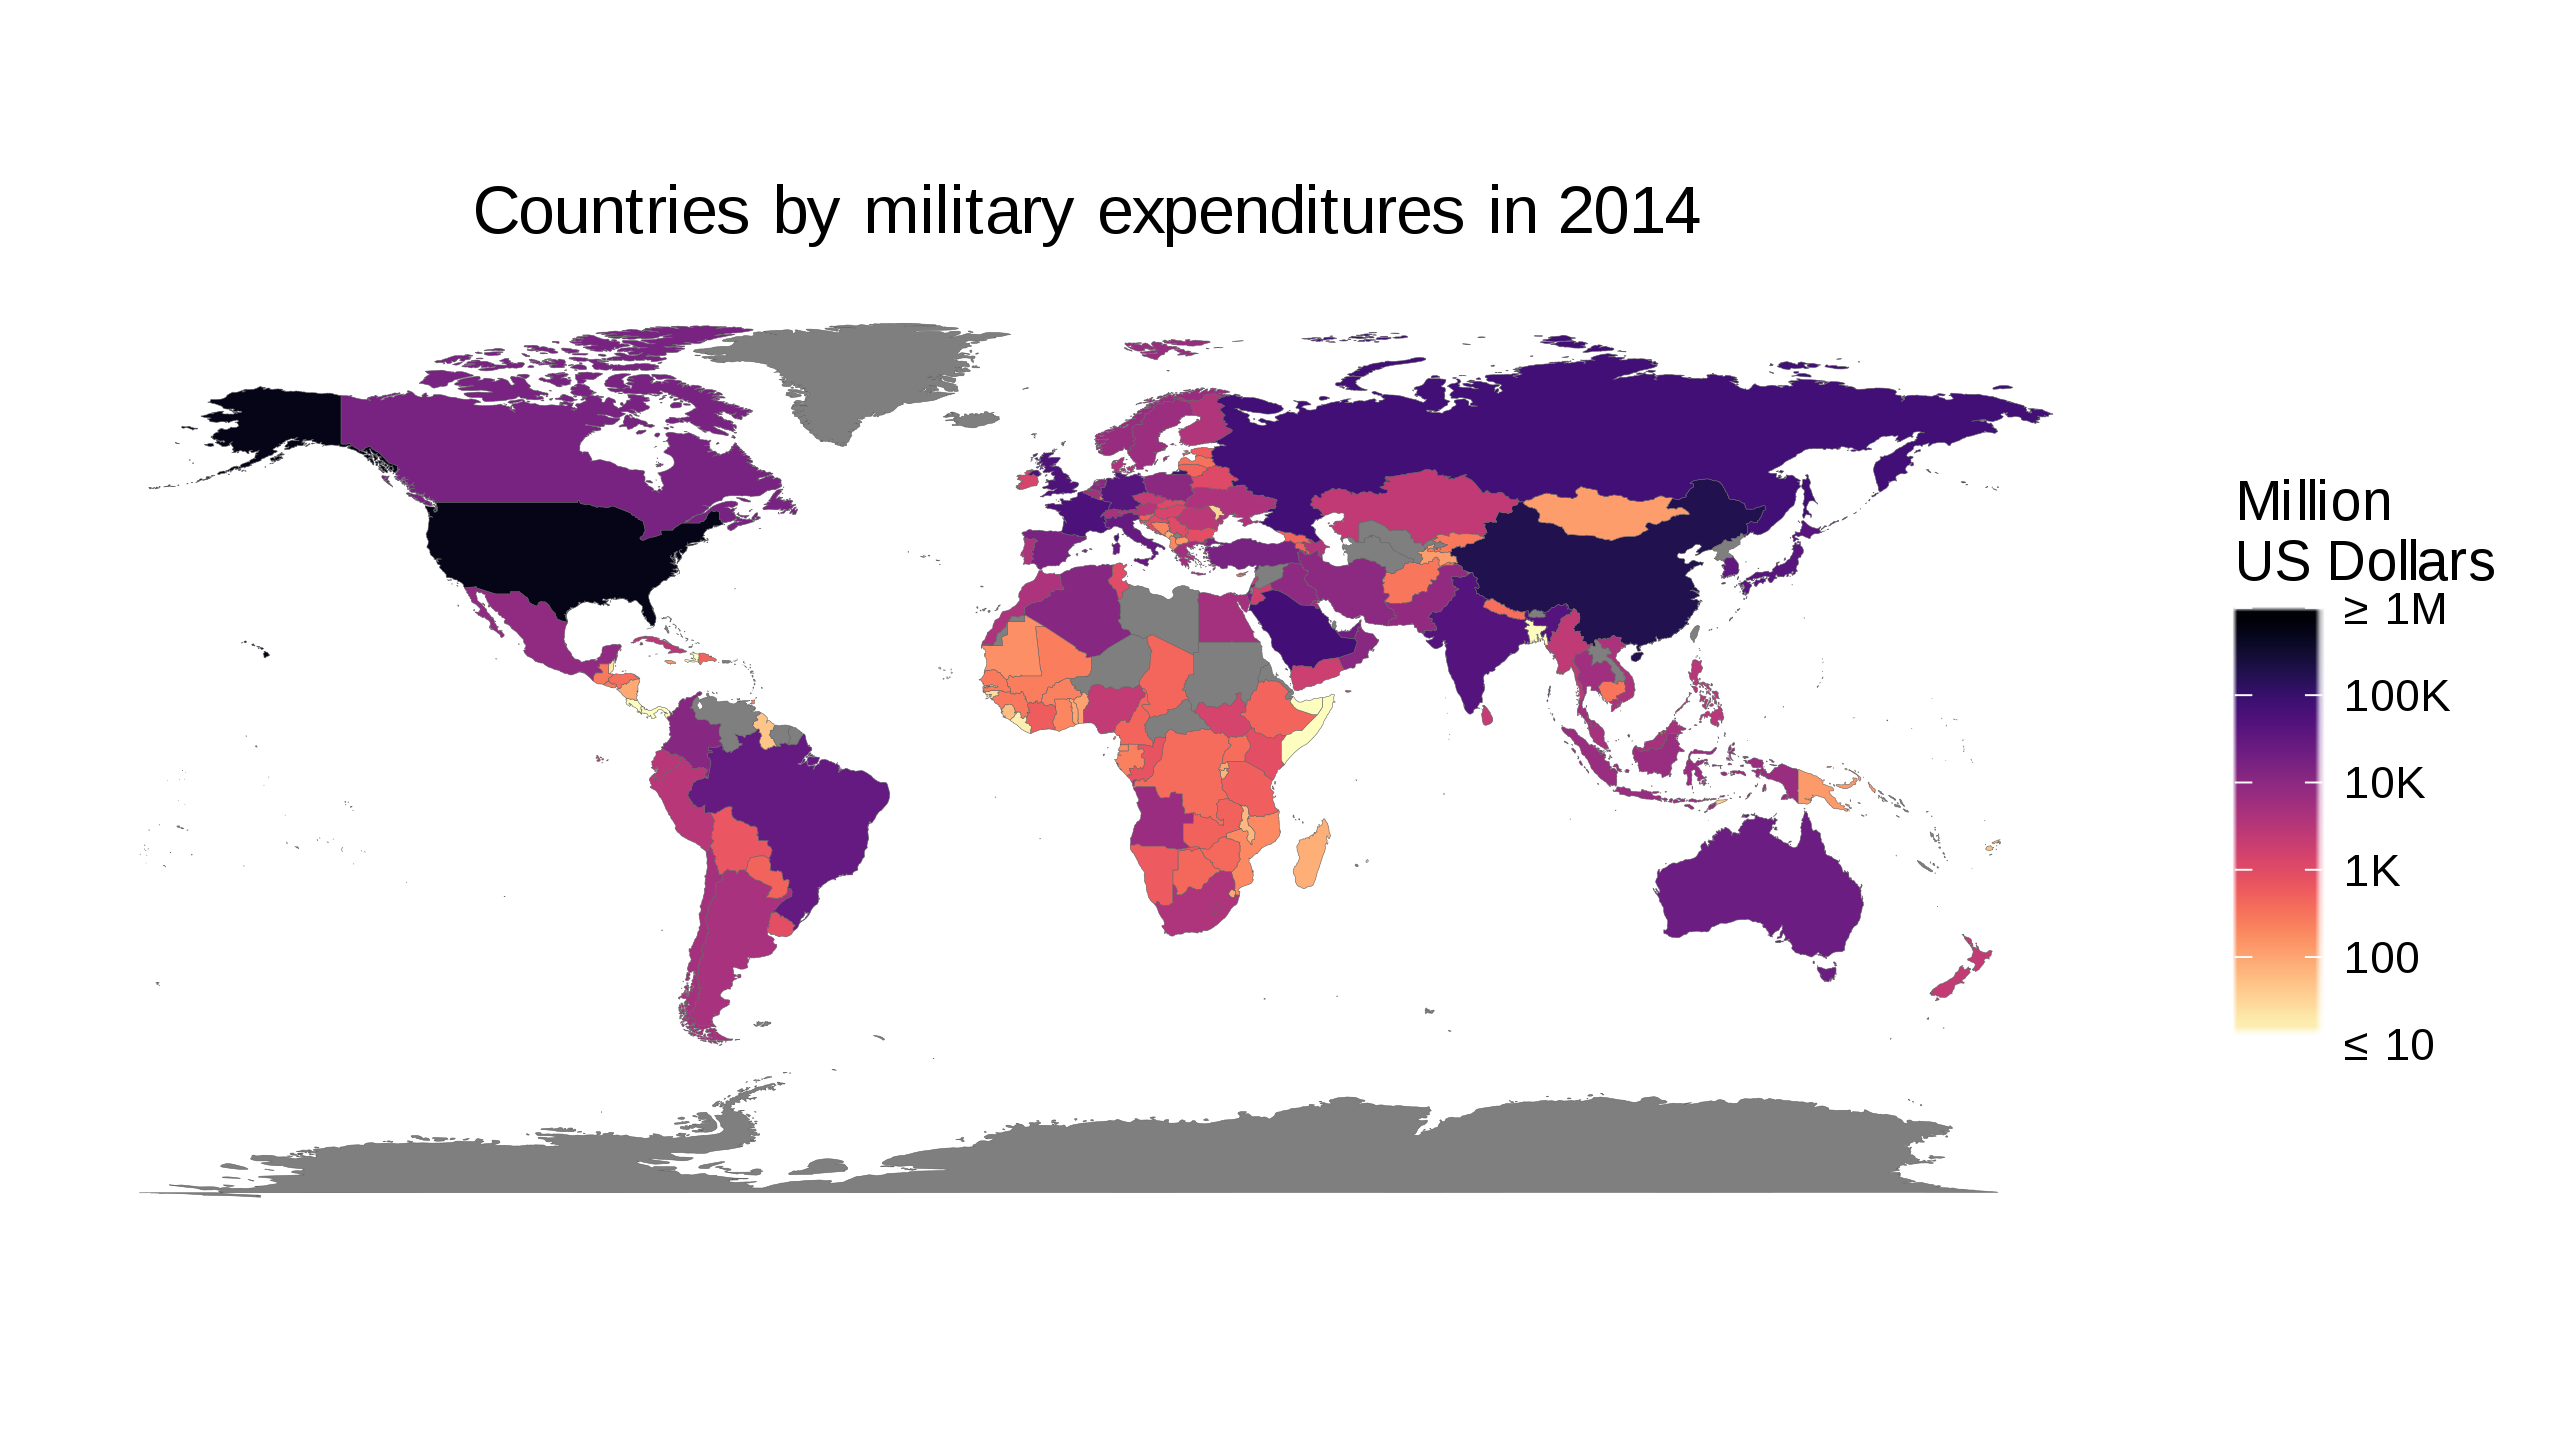
English: Based on the Worldbank data from http://data.worldbank.org/indicator/MS.MIL.XPND.GD.ZS and http://data.worldbank.org/indicator/NY.GDP.MKTP.CD This is a candidate for replacing/augmenting https://commons.wikimedia.org/wiki/File:Countries_by_Military_expenditures_(%25_of_GDP)_in_2014_v2.svg |
| Font | Treball propi |
| Autor | Pipping |
_in_2014_v2.svg)
Llicència
Jo, el titular dels drets d'autor d'aquest treball, el public sota la següent llicència:
This file is licensed under the Creative Commons Attribution-Share Alike 4.0 International license.
- Sou lliure de:
- compartir – copiar, distribuir i comunicar públicament l'obra
- adaptar – fer-ne obres derivades
- Amb les condicions següents:
- reconeixement – Heu de donar la informació adequada sobre l'autor, proporcionar un enllaç a la llicència i indicar si s'han realitzat canvis. Podeu fer-ho amb qualsevol mitjà raonable, però de cap manera no suggereixi que l'autor us dóna suport o aprova l'ús que en feu.
- compartir igual – Si modifiqueu, transformeu, o generareu amb el material, haureu de distribuir les vostres contribucions sota una llicència similar o una de compatible com l'original
Created with the following piece of code:
library(magrittr)

selectedYear <- 2014

getWorldBankData <- function(indicatorCode, indicatorName) {
    baseName <- paste('API', indicatorCode, 'DS2_en_csv_v2', sep='_')
    ## Download zipfile if necessary
    zipfile <- paste(baseName, 'zip', sep='.')
    if (!file.exists(zipfile)) {
        zipurl <- paste(paste('http://api.worldbank.org/v2/en/indicator',
                              indicatorCode, sep='/'),
                        'downloadformat=csv', sep='?')
        download.file(zipurl, zipfile)
    }
    csvfile <- paste(baseName, 'csv', sep='.')
    ## This produces a warning because of the trailing commas. Safe to ignore.
    readr::read_csv(unz(zipfile, csvfile), skip=4,
                    col_types = list(`Indicator Name` = readr::col_character(),
                                     `Indicator Code` = readr::col_character(),
                                     `Country Name` = readr::col_character(),
                                     `Country Code` = readr::col_character(),
                                     .default = readr::col_double())) %>%
        dplyr::select(-c(`Indicator Name`, `Indicator Code`, `Country Name`))
}

## Obtain and merge World Bank data
worldBankData <-
    dplyr::left_join(
               getWorldBankData('MS.MIL.XPND.GD.ZS') %>%
               tidyr::gather(-`Country Code`, convert=TRUE,
                             key='Year', value=`Military expenditure (% of GDP)`,
                             na.rm = TRUE),
               getWorldBankData('NY.GDP.MKTP.CD') %>%
               tidyr::gather(-`Country Code`, convert=TRUE,
                             key='Year', value=`GDP (current US$)`,
                             na.rm = TRUE)) %>%
    dplyr::mutate(`Military expenditure (current $US)` =
                      `Military expenditure (% of GDP)`*`GDP (current US$)`/100) %>%
    dplyr::filter(Year == selectedYear) %>%
    dplyr::mutate(Year = NULL)

## Plotting: Obtain Geographic data
mapData <- tibble::as.tibble(ggplot2::map_data("world")) %>%
    dplyr::mutate(`Country Code` =
                      countrycode::countrycode(region, "country.name", "iso3c"),
                  ## This produces a warning but I do not see how we could do better
                  ## since we started with fuzzy names.
                  region = NULL, subregion = NULL)

combinedData <- dplyr::left_join(mapData, worldBankData)

## The default out-of-bounds function `censor` replaces values outside
## the range with NA. Since we have properly labelled the legend, we can
## project them onto the boundary instead
clamp <- function(x, range = c(0, 1)) {
    lower <- range[1]
    upper <- range[2]
    ifelse(x > lower, ifelse(x < upper, x, upper), lower)
}

ggplot2::ggplot(data = combinedData, ggplot2::aes(long,lat)) +
    ggplot2::geom_polygon(ggplot2::aes(group = group,
                                       fill  = `Military expenditure (current $US)`),
                          color = '#606060', lwd=0.05) +
    ggplot2::scale_fill_gradientn(colours= rev(viridis::magma(256, alpha = 0.5)),
                                  name   = "Million\nUS Dollars",
                                  trans  = "log",
                                  oob    = clamp,
                                  breaks = c(1e7,1e8,1e9,1e10,1e11,1e12),
                                  labels = c('\u2264 10', '100', '1K',
                                             '10K', '100K', '\u2265 1M'),
                                  limits = c(1e7,1e12)) +
    ggplot2::coord_fixed() +
    ggplot2::theme_bw() +
    ggplot2::theme(plot.title = ggplot2::element_text(hjust = 0.5),
          axis.title = ggplot2::element_blank(),
          axis.text = ggplot2::element_blank(),
          axis.ticks = ggplot2::element_blank(),
          panel.grid.major = ggplot2::element_blank(),
          panel.grid.minor = ggplot2::element_blank(),
          panel.border = ggplot2::element_blank(),
          panel.background = ggplot2::element_blank()) +
    ggplot2::labs(title = paste("Countries by military expenditures in",
                                selectedYear))

ggplot2::ggsave(paste(selectedYear, 'militrary_expenditures_absolute.svg', sep='_'),
                height=100, units='mm')
Historial del fitxer
Cliqueu una data/hora per veure el fitxer tal com era aleshores.
| Data/hora | Miniatura | Dimensions | Usuari/a | Comentari | |
|---|---|---|---|---|---|
| actual | 16:30, 20 maig 2017 | | 512 × 288 (1,52 Mo) | Pipping | redo with dplyr |
| 14:12, 13 maig 2017 |  | 512 × 256 (1,51 Mo) | Pipping | Handle truncation of the data range better: We distinguish between 0 and no data, but any existing datum below 10M USD is coloured the same way and all data above 1T USD are coloured the same way. The legend makes this clear. | |
| 10:55, 13 maig 2017 |  | 512 × 256 (1,51 Mo) | Pipping | Completely redone. The former was in local currency (so that comparisons from country to country made absolutely no sense). Now everything is in current US dollars. | |
| 00:32, 12 maig 2017 |  | 512 × 256 (1,5 Mo) | Pipping | Fixed min/max value for colors that kept anything below 1,000,000,000 US dollars from having a colour (now: Anything above 1,000,000 US dollars has a colour). | |
| 23:30, 11 maig 2017 |  | 512 × 256 (1,51 Mo) | Pipping | {{Information |Description ={{en|1=English: Based on the Worldbank data from http://data.worldbank.org/indicator/MS.MIL.XPND.CN This is a candidate for replacing/augmenting https://commons.wikimedia.org/wiki/File:Countries_by_Military_expenditures_(... |
Ús del fitxer
La pàgina següent utilitza aquest fitxer:
Ús global del fitxer
Utilització d'aquest fitxer en altres wikis:
- Utilització a bg.wikipedia.org
- Utilització a en.wikipedia.org
- Utilització a eu.wikipedia.org
- Utilització a sr.wikipedia.org
- Utilització a th.wikipedia.org
- Utilització a uk.wikipedia.org