Fitxer:Evolution of complexity.svg

Mida d'aquesta previsualització PNG del fitxer SVG: 688 × 600 píxels. Altres resolucions: 275 × 240 píxels | 550 × 480 píxels | 881 × 768 píxels | 1.174 × 1.024 píxels | 2.349 × 2.048 píxels | 1.665 × 1.452 píxels.
Fitxer original (fitxer SVG, nominalment 1.665 × 1.452 píxels, mida del fitxer: 48 Ko)
| Aquest fitxer i la informació mostrada a continuació provenen del dipòsit multimèdia lliure Wikimedia Commons. |
Resum
| Descripció |
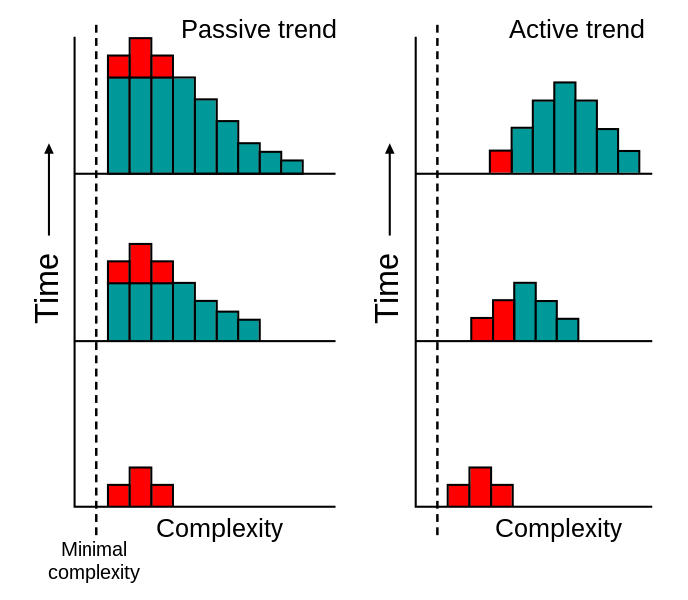
Graphic showing the two different ways complexity can increase during evolution. See evolution for more details. Aquesta imatge vectorial ha estat creada amb Inkscape . |
||
| Data | |||
| Font | Vector version of en:Image:Evolution of complexity.png | ||
| Autor | Fvasconcellos, original by Tim Vickers | ||
| Permís (Com reutilitzar aquest fitxer) |
|
||
| Altres versions |
 |
Historial del fitxer
Cliqueu una data/hora per veure el fitxer tal com era aleshores.
| Data/hora | Miniatura | Dimensions | Usuari/a | Comentari | |
|---|---|---|---|---|---|
| actual | 17:15, 15 maig 2007 | | 1.665 × 1.452 (48 Ko) | Fvasconcellos | == Summary == {{Information |Description= Graphic showing the two different ways complexity can increase during evolution. See {{w|evolution}} for more details.<br>{{Created with Inkscape}} |Source= Vector version of [[:en:Image:Evolution of complexity. |
Ús del fitxer
La pàgina següent utilitza aquest fitxer:
Ús global del fitxer
Utilització d'aquest fitxer en altres wikis:
- Utilització a de.wikipedia.org
- Utilització a en.wikipedia.org
- Utilització a fa.wikipedia.org
- Utilització a gl.wikipedia.org
- Utilització a he.wikipedia.org
- Utilització a ja.wikipedia.org