Fitxer:Evolution of temperature in the Post-Glacial period according to Greenland ice cores.jpg
Mida d'aquesta previsualització: 800 × 222 píxels. Altres resolucions: 320 × 89 píxels | 640 × 178 píxels | 1.786 × 496 píxels.
Fitxer original (1.786 × 496 píxels, mida del fitxer: 281 Ko, tipus MIME: image/jpeg)
| Aquest fitxer i la informació mostrada a continuació provenen del dipòsit multimèdia lliure Wikimedia Commons. |
Resum
| Descripció |
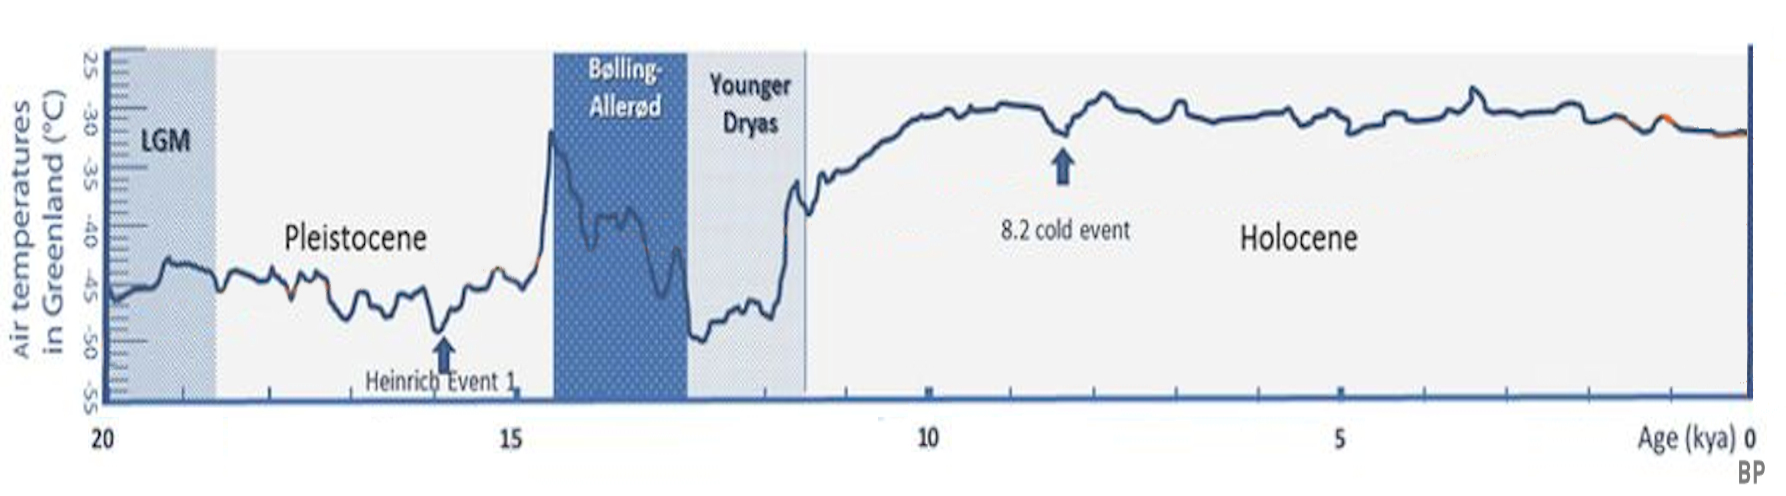
English: Reconstructed air temperatures from the GISP 2 Ice core in Greenland |
||
| Data | |||
| Font |
Mapping Post-Glacial expansions: The Peopling of Southwest Asia |
||
| Autor | Daniel E. Platt, Marc Haber, Magda Bou Dagher-Kharrat, Bouchra Douaihy, Georges Khazen, Maziar Ashrafian Bonab, Angélique Salloum, Francis Mouzaya, Donata Luiselli, Chris Tyler-Smith, Colin Renfrew, Elizabeth Matisoo-Smith & Pierre A. Zalloua | ||
| Altres versions |
|


Llicència
This file is licensed under the Creative Commons Attribution-Share Alike 4.0 International license.
- Sou lliure de:
- compartir – copiar, distribuir i comunicar públicament l'obra
- adaptar – fer-ne obres derivades
- Amb les condicions següents:
- reconeixement – Heu de donar la informació adequada sobre l'autor, proporcionar un enllaç a la llicència i indicar si s'han realitzat canvis. Podeu fer-ho amb qualsevol mitjà raonable, però de cap manera no suggereixi que l'autor us dóna suport o aprova l'ús que en feu.
- compartir igual – Si modifiqueu, transformeu, o generareu amb el material, haureu de distribuir les vostres contribucions sota una llicència similar o una de compatible com l'original
Historial del fitxer
Cliqueu una data/hora per veure el fitxer tal com era aleshores.
| Data/hora | Miniatura | Dimensions | Usuari/a | Comentari | |
|---|---|---|---|---|---|
| actual | 22:41, 16 maig 2019 | 1.786 × 496 (281 Ko) | पाटलिपुत्र | better | |
| 13:24, 16 maig 2019 | 1.786 × 372 (238 Ko) | पाटलिपुत्र | User created page with UploadWizard |
Ús del fitxer
La pàgina següent utilitza aquest fitxer:
Ús global del fitxer
Utilització d'aquest fitxer en altres wikis:
- Utilització a af.wikipedia.org
- Utilització a ar.wikipedia.org
- Utilització a de.wikipedia.org
- Utilització a en.wikipedia.org
- Utilització a es.wikipedia.org
- Utilització a fr.wikipedia.org
- Utilització a he.wikipedia.org
- Utilització a id.wikipedia.org
- Utilització a ie.wikipedia.org
- Utilització a it.wikipedia.org
- Utilització a ja.wikipedia.org
- Utilització a kk.wikipedia.org
- Utilització a lfn.wikipedia.org
- Utilització a mk.wikipedia.org
- Utilització a ms.wikipedia.org
- Utilització a ru.wikipedia.org
- Utilització a te.wikipedia.org
- Utilització a th.wikipedia.org
- Utilització a tr.wikipedia.org
- Utilització a vi.wikipedia.org
- Utilització a zh.wikipedia.org