Fitxer:Moon trajectory1.svg

Fitxer original (fitxer SVG, nominalment 1.600 × 223 píxels, mida del fitxer: 2 Ko)
| Aquest fitxer i la informació mostrada a continuació provenen del dipòsit multimèdia lliure Wikimedia Commons. |
Resum
| Descripció |
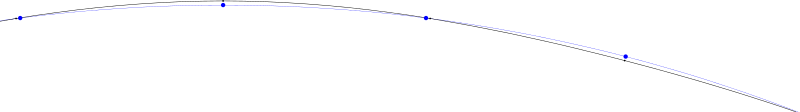
English: Section of the Earth–Moon system's trajectory around the Sun in proper scale. ▇ orbital path of the Earth Español: Un diagrama que ilustra la coórbita de la Luna con la Tierra.
import numpy as np import matplotlib.pyplot as plt rEM = 38 # SVG pixel per |Earth-Moon|; we're going to round to int. rSE = rEM*389.168 # pixel per |Sun-Earth| n = 10 # polygon segments per quarter month; with cubic splines, n = 1 would probably suffice. p = 12.4 # synodic months per year; 4*n*p segments per year. θ = 2*np.pi*np.arange(-n-1, 3*n)/(4*n*p) # one month xE = rSE*np.sin(θ) yE =-rSE*np.cos(θ) xM = rSE*np.sin(θ) + rEM*(np.sin(p*θ)*np.cos(θ) + np.cos(p*θ)*np.sin(θ)) # Rotate rM vector by Earth's arc angle. yM =-rSE*np.cos(θ) - rEM*(np.cos(p*θ)*np.cos(θ) - np.sin(p*θ)*np.sin(θ)) fig, ax = plt.subplots(figsize=(19,2.5)) ax.plot(xE, yE, 'b-', linewidth=.5) ax.plot(xM, yM, 'k-') ax.plot(xE[1::n], yE[1::n], 'bo', markersize=5) ax.plot(xM[1::n], yM[1::n], 'ko', markersize=2) fig.tight_layout() fig.show() xE = xE.astype(int) yE = yE.astype(int) xM = xM.astype(int) yM = yM.astype(int) rM = 8; rE = 20 # radii, not to scale (would be 0.17 and 0.63) open('out.svg', 'w').write(f<?xml version="1.0" encoding="UTF-8"?> <svg xmlns="http://www.w3.org/2000/svg" width="1600" height="{1600*(rSE+rEM+rM+yM[-1])/(xE[-1]-xE[0])}" viewBox="{xE[0]} {-(rSE+rEM+rM)} {xE[-1]-xE[0]} {rSE+rEM+rM+yM[-1]}"> <defs> <marker id="E" overflow="visible"><circle r="{rE}" fill="blue"/></marker> <marker id="M" overflow="visible"><circle r="{rM}" fill="black"/></marker> </defs> <path fill="none" stroke="blue" stroke-width="2" d="M{'L'.join([x+' '+y for x,y in zip(xE.astype(str), yE.astype(str))])}"/> <path fill="none" stroke="black" stroke-width="4" d="M{'L'.join([x+' '+y for x,y in zip(xM.astype(str), yM.astype(str))])}"/> <path fill="none" stroke="none" marker-start="url(#M)" marker-mid="url(#M)" marker-end="url(#M)" d="M{'L'.join([x+' '+y for x,y in zip(xM[1::n].astype(str), yM[1::n].astype(str))])}"/> <path fill="none" stroke="none" marker-start="url(#E)" marker-mid="url(#E)" marker-end="url(#E)" d="M{'L'.join([x+' '+y for x,y in zip(xE[1::n].astype(str), yE[1::n].astype(str))])}"/> </svg> ) |
| Data | |
| Font | Treball propi |
| Autor | de:User:Rainald62 |
Llicència
| Jo, el titular del copyright d'aquesta obra, l'allibero al domini públic. Això s'aplica a tot el món. En alguns països això pot no ser legalment possible, en tal cas: Jo faig concessió a tothom del dret d'usar aquesta obra per a qualsevol propòsit, sense cap condició llevat d'aquelles requerides per la llei. |
Historial del fitxer
Cliqueu una data/hora per veure el fitxer tal com era aleshores.
| Data/hora | Miniatura | Dimensions | Usuari/a | Comentari | |
|---|---|---|---|---|---|
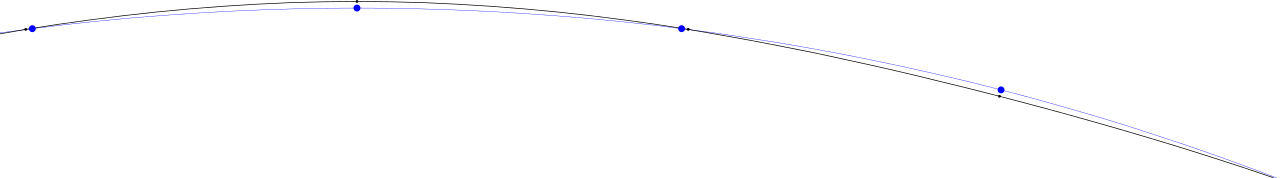
| actual | 18:18, 14 jul 2020 | 1.600 × 223 (2 Ko) | Rainald62 | Trajectories calculated instead of drawn by hand. Less stroke-width for Earth's trajectory. Lower figure height. | |
| 19:08, 17 maig 2007 |  | 800 × 392 (3 Ko) | Tó campos1 | ||
| 17:54, 17 maig 2007 |  | 800 × 392 (5 Ko) | Tó campos1 |
Ús del fitxer
La pàgina següent utilitza aquest fitxer:
Ús global del fitxer
Utilització d'aquest fitxer en altres wikis:
- Utilització a de.wikipedia.org
- Utilització a el.wikipedia.org
- Utilització a en.wikipedia.org
- Utilització a es.wikipedia.org
- Utilització a et.wikipedia.org
- Utilització a eu.wikipedia.org
- Utilització a fr.wikipedia.org
- Définition des planètes
- Orbite de la Lune
- Discussion:Orbite de la Lune
- Wikipédia:Le saviez-vous ?/Archives/2015
- Utilisateur:GhosterBot/BacASable/testStat/Visibilité des anecdotes (2015)
- Utilisateur:GhosterBot/BacASable/testStat/Visibilité des anecdotes (2015)/2015 02
- Wikipédia:Statistiques des anecdotes de la page d'accueil/Visibilité des anecdotes (2015)/2015 02
- Wikipédia:Statistiques des anecdotes de la page d'accueil/Visibilité des anecdotes (2015)
- Discussion:Tesla Roadster (engin spatial)/LSV 21645
- Utilització a it.wikipedia.org
- Utilització a ja.wikipedia.org
- Utilització a mk.wikipedia.org
- Utilització a pt.wikipedia.org
- Utilització a vi.wikipedia.org
- Utilització a zh.wikipedia.org