Fitxer:Atmospheric Transmission.png

Fitxer original (850 × 857 píxels, mida del fitxer: 75 Ko, tipus MIME: image/png)
| Aquest fitxer i la informació mostrada a continuació provenen del dipòsit multimèdia lliure Wikimedia Commons. |

|
File:Atmospheric Transmission-en.svg és una versió vectorial (SVG) d'aquest fitxer. En cas de ser millor, hauria de ser emprada en lloc d'aquesta imatge tramada.
File:Atmospheric Transmission.png → File:Atmospheric Transmission-en.svg
Per a més informació pel que fa als gràfics vectorials, llegiu la transició a SVG en Commons. També hi ha informació quant a la compatibilitat del MediaWiki amb les imatges SVG. |
 |
Transwiki approved by: w:en:User:Dmcdevit
This image was copied from wikipedia:en. The original description was:
Resum
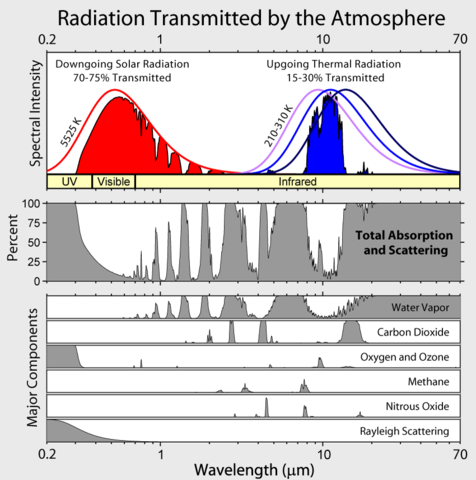
This figure shows the absorption bands in the Earth's atmosphere (middle panel) (when there are no clouds present: clouds average 60-65% cover and independently impact radiation transfer) and the effect that this has on both solar radiation and upgoing thermal radiation (top panel). Individual absorption spectrum for major greenhouse gases plus Rayleigh scattering are shown in the lower panel.
Both the Earth and the Sun emit electromagnetic radiation (e.g. light) that closely follows a blackbody spectrum, and which can be predicted based solely on their respective temperatures. For the Sun, these emissions peak in the visible region and correspond to a temperature of ~5500 K. Emissions from the Earth vary following variations in temperature across different locations and altitudes, but always peak in the infrared.
The position and number of absorption bands are determined by the chemical properties of the gases present. In the present atmosphere, water vapor is the most significant of these greenhouse gases, followed by carbon dioxide and various other minor greenhouse gases. In addition, Rayleigh scattering, the physical process that makes the sky blue, also disperses some incoming sunlight. Collectively these processes capture and redistribute 25-30% of the energy in direct sunlight passing through the atmosphere. By contrast, the greenhouse gases capture 70-85% of the energy in upgoing thermal radiation emitted from the Earth surface.
Data sources and notes
The data used for these figures is based primarily on Spectral Calculator of GATS, Inc. archive copy at the Wayback Machine which implements the LINEPAK system of calculating absorption spectra (Gordley et al. 1994) from the HITRAN2004 (Rothman et al. 2004) spectroscopic database. To aid presentation, the absorption spectra were smoothed. Features with a bandwidth narrower than 0.5% of their wavelength may be obscured.
Calculations were done on the assumption of direct vertical transmission through an atmosphere with gas concentrations representative of modern day averages. In particular, absorption would be greater for radiation traveling obliquely through the atmosphere as it would encounter more gas.
The total scattering and absorption curve includes only the components indicated in the lower panel. These represent the vast majority of absorption contributing to the greenhouse effect and follow the treatment of Peixoto and Oort (1992), but other minor species such as carbon monoxide, nitric oxide and chloroflourocarbons (CFCs) have been omitted. Also omitted was scattering due to aerosols and other sources besides Rayleigh scattering.
The peaks in the blackbody spectra were adjusted to have the same height for ease in presentation.
Copyright
This figure was prepared by Robert A. Rohde for the Global Warming Art project.

|
S'autoritza la còpia, la distribució i la modificació d'aquest document sota els termes de la llicència de documentació lliure GNU versió 1.2 o qualsevol altra versió posterior que publiqui la Free Software Foundation; sense seccions invariants, ni textos de portada, ni textos de contraportada. S'inclou una còpia d'aquesta llicència en la secció titulada GNU Free Documentation License. |
| Aquest fitxer està subjecte a la llicència de Creative Commons Reconeixement i Compartir Igual 3.0 No adaptada. | ||
| ||
| Aquest avís de llicència s'ha afegit a aquest fitxer d'acord amb l'actualització de la llicència GFDL. |
References
- Gordley, Larry L., Benjamin T. Marshall, Allen D. Chu (1994). "LINEPAK: Algorithms for modeling spectral transmittance and radiance". Journal of Quantitative Spectroscopy & Radiative Transfer 52 (5): 563-580. DOI:10.1016/0022-4073(94)90025-6.
- L.S. Rothman, D. Jacquemart, A. Barbe, D. Chris Benner, M. Birk, L.R. Brown, M.R. Carleer, C. Chackerian Jr., K. Chance, L.H. Coudert, V. Dana, V.M. Devi, J.-M. Flaud, R.R. Gamache, A. Goldman, J.-M. Hartmann, K.W. Jucks, A.G. Maki, J.-Y. Mandin, S.T. Massie, J. Orphal, A. Perrin, C.P. Rinsland, M.A.H. Smith, J. Tennyson, R.N. Tolchenov, R.A. Toth, J. Vander Auwera, P. Varanasi, G. Wagner (2004). "The HITRAN 2004 molecular spectroscopic database". Journal of Quantitative Spectroscopy & Radiative Transfer 96: 139-204.
- Peixoto, Jose P. and Abraham H. Oort (1992) Physics of Climate, Springer ISBN: 0883187124.
Other versions
[]
.svg:
-
 anglès .svg
 -
 francès .svg
 -
 macedoni .svg
 -
 rus .svg
 -
 coreà .svg


.png:
-
 anglès .png
 -
 francès .png
 -
 polonès .png
 -
 japonès .png
 -
 àrab .png


Registre original de càrregues
| date/time | username | resolution | size | edit summary |
|---|---|---|---|---|
| 22:55, 13 June 2007 | w:en:User:Dragons flight | 850×857 | 76,567 | ({{GWArt}}) |
Image description page history
| link | date/time | username | edit summary |
|---|---|---|---|
| http://en.wikipedia.org/w/index.php?title=Image:Atmospheric_Transmission.png&redirect=no&oldid=138013407 | 08:22, 25 August 2007 | w:en:User:Dmcdevit | |
| http://en.wikipedia.org/w/index.php?title=Image:Atmospheric_Transmission.png&redirect=no&oldid=138013407 | 23:00, 13 June 2007 | w:en:User:Dragons flight | |
| http://en.wikipedia.org/w/index.php?title=Image:Atmospheric_Transmission.png&redirect=no&oldid=138012501 | 22:55, 13 June 2007 | w:en:User:Dragons flight | ({{GWArt}}) |
| Anotacions | Aquesta imatge té anotacions: Vegeu-les a Commons |
Historial del fitxer
Cliqueu una data/hora per veure el fitxer tal com era aleshores.
| Data/hora | Miniatura | Dimensions | Usuari/a | Comentari | |
|---|---|---|---|---|---|
| actual | 11:24, 25 ago 2007 | | 850 × 857 (75 Ko) | BetacommandBot | Transwiki approved by: w:en:User:Dmcdevit This image was copied from wikipedia:en. The original description was: == Description == [[w:en:Image:Greenhouse Effect.png|thumb|right|300px|Shows how the absorption and recycling of energy by the atmosphe |
Ús del fitxer
La pàgina següent utilitza aquest fitxer:
Ús global del fitxer
Utilització d'aquest fitxer en altres wikis:
- Utilització a bg.wikipedia.org
- Utilització a bn.wikipedia.org
- Utilització a cs.wikipedia.org
- Utilització a de.wikipedia.org
- Utilització a de.wikiversity.org
- Utilització a el.wikipedia.org
- Utilització a en.wikipedia.org
- Utilització a en.wikibooks.org
- Utilització a en.wikiversity.org
- Utilització a es.wikipedia.org
- Utilització a fr.wikipedia.org
- Utilització a gu.wikipedia.org
- Utilització a he.wikipedia.org
- Utilització a hr.wikipedia.org
- Utilització a id.wikipedia.org
- Utilització a lb.wikipedia.org
- Utilització a ms.wikipedia.org
- Utilització a nn.wikipedia.org
- Utilització a no.wikipedia.org
- Utilització a ro.wikipedia.org
- Utilització a sh.wikipedia.org
- Utilització a si.wikipedia.org
- Utilització a ta.wikipedia.org
- Utilització a te.wikipedia.org
- Utilització a th.wikipedia.org
- Utilització a ur.wikipedia.org