Fitxer:Helmholtz solution.png

Mida d'aquesta previsualització: 298 × 598 píxels. Altres resolucions: 119 × 240 píxels | 239 × 480 píxels | 975 × 1.957 píxels.
Fitxer original (975 × 1.957 píxels, mida del fitxer: 23 Ko, tipus MIME: image/png)
| Aquest fitxer i la informació mostrada a continuació provenen del dipòsit multimèdia lliure Wikimedia Commons. |
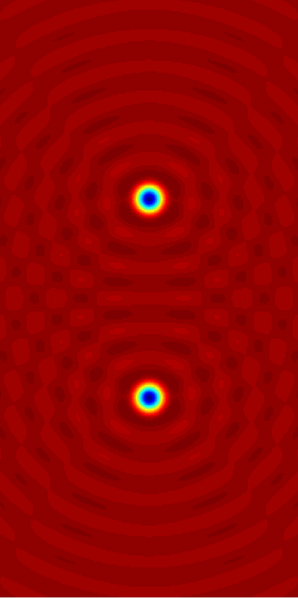
| Descripció | Illustration of en:Helmholtz equation. |
| Data | (UTC) |
| Font | self-made with en:Matlab. See the source code below. |
| Autor | Oleg Alexandrov |
Aquesta PNG imatge rasteritzada ha estat creada amb MATLAB.
| Jo, el titular del copyright d'aquesta obra, l'allibero al domini públic. Això s'aplica a tot el món. En alguns països això pot no ser legalment possible, en tal cas: Jo faig concessió a tothom del dret d'usar aquesta obra per a qualsevol propòsit, sense cap condició llevat d'aquelles requerides per la llei. |
Source code (MATLAB)
% Plot the solution to the Helmholtz equation with a given source
clear all;

Box_x = 3;
Scale = 0.5;
Box_y = Box_x/Scale;

Nx = 200;
Ny = Nx/Scale;

wavenumber = 10;

XX = linspace(-Box_x, Box_x, Nx);
YY = linspace(-Box_y, Box_y, Ny);
hx = XX(2) - XX(1);
hy = YY(2) - YY(1);
[X, Y] = meshgrid(XX, YY);

Source_size  = 0.5;
Source_shift = 2;
Source =  max(Source_size^2 - X.^2-(Y-Source_shift).^2, 0) + max(Source_size^2 - X.^2-(Y+Source_shift).^2, 0) ;

% plot the source
figure(1); clf; hold on; axis equal; axis off;
imagesc(Source);


% plot the solution to the Helmholtz equation
I = sqrt(-1);
Field = 0*X;

[m, n] = size(Source);
for i=1:m
   i
   for j=1:n

      if Source(i, j) ~= 0

	 x0 = X(i, j);
	 y0 = Y(i, j);

	 % add the contribution from the current source
	 Field = Field + (I/4)*besselh(0, 1, wavenumber*sqrt((X-x0).^2+(Y-y0).^2) + eps)*Source(i, j)*hx*hy;
      end

   end
end


figure(2); clf; hold on; axis equal; axis off;
imagesc(real(Field));

% Save to disk and convert to png right away
figure(1);
saveas(gcf, 'Helmholtz_source.eps', 'psc2');
%! convert -density 200 Helmholtz_source.eps Helmholtz_source.png

figure(2);
saveas(gcf, 'Helmholtz_solution.eps', 'psc2');
%! convert -density 200 Helmholtz_solution.eps Helmholtz_solution.png

|
Aquesta imatge (de tipus math) s'hauria de tornar a crear utilitzant gràfics vectorials com ara un fitxer SVG. Això té diversos avantatges; en trobareu més informació a Commons:Media for cleanup. Si ja disposeu d'una versió d'aquesta imatge en format SVG, us preguem que la pengeu; després, reemplaceu aquesta plantilla amb la plantilla {{Vector version available|nom nou de la imatge.svg}} en aquesta imatge.
|
Historial del fitxer
Cliqueu una data/hora per veure el fitxer tal com era aleshores.
| Data/hora | Miniatura | Dimensions | Usuari/a | Comentari | |
|---|---|---|---|---|---|
| actual | 21:50, 7 jul 2007 | | 975 × 1.957 (23 Ko) | Oleg Alexandrov | Tweak |
| 06:18, 7 jul 2007 |  | 500 × 989 (22 Ko) | Oleg Alexandrov | Higher res. | |
| 05:59, 7 jul 2007 |  | 500 × 989 (15 Ko) | Oleg Alexandrov | {{Information |Description=Illustration of en:Helmholtz equation. |Source=self-made with en:Matlab. See the source code below. |Date=03:56, 7 July 2007 (UTC) |Author= Oleg Alexandrov }} {{PD-self}} ==MATLAB source code |
Ús del fitxer
La pàgina següent utilitza aquest fitxer:
Ús global del fitxer
Utilització d'aquest fitxer en altres wikis:
- Utilització a ar.wikipedia.org
- Utilització a en.wikipedia.org
- Utilització a et.wikipedia.org
- Utilització a fa.wikipedia.org
- Utilització a fr.wikipedia.org
- Utilització a ko.wikipedia.org
- Utilització a no.wikipedia.org
- Utilització a pt.wikipedia.org
- Utilització a sq.wikipedia.org
- Utilització a vi.wikipedia.org
- Utilització a www.wikidata.org
- Utilització a zh.wikipedia.org