Fitxer:NZ opinion polls 2011-2014-majorparties.png
No hi ha cap versió amb una resolució més gran.
NZ_opinion_polls_2011-2014-majorparties.png (778 × 487 píxels, mida del fitxer: 13 Ko, tipus MIME: image/png)
| Aquest fitxer i la informació mostrada a continuació provenen del dipòsit multimèdia lliure Wikimedia Commons. |
Resum
| Descripció |
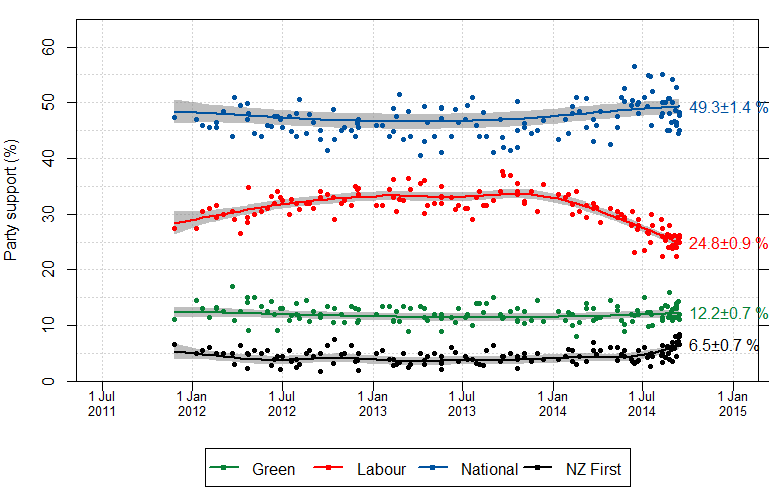
English: Graph showing support for political parties in New Zealand since the 2011 election, according to various political polls. Data is obtained from the Wikipedia page, Opinion polling for the Next New Zealand general election |
| Data | |
| Font | Treball propi |
| Autor | Mark Payne, Denmark |

|
This file may be updated to reflect new information. If you wish to use a specific version of the file without new updates being mirrored, please upload the required version as a separate file. |
Aquesta PNG imatge rasteritzada ha estat creada amb R.
Figure is produced using the R statistical package, using the following code. It first reads the HTML directly from the website, then parses the data and saves the graph into your working directory. It should be able to be run directly by anyone with R.
rm(list=ls())
library(mgcv)

#==========================================
#Parameters - specified as a list
opts <- list()
opts$major <- list(parties= c("Green","Labour","National","NZ First"),   #use precise names from Table headers
                   ylims = c(0,65),   #Vertical range
                   fname= "NZ_opinion_polls_2011-2014-majorparties.png",
                   dp=0)  #Number of decimal places to round estimates to
opts$minor <- list(parties=c("ACT","Maori","United Future","Mana","Conservative","Internet Mana"),   #please use "Maori" for the Maori party
                   ylims = c(0,6),   #Vertical range
                   fname = "NZ_opinion_polls_2011-2014-minorparties.png",
                   dp=1) #Number of decimal places to round estimates to

#==========================================
#Shouldn't need to edit anything below here
#==========================================

#Load the complete HTML file into memory
html <- readLines(url("http://en.wikipedia.org/wiki/Opinion_polling_for_the_next_New_Zealand_general_election",encoding="UTF-8"))
closeAllConnections()

#Extract the opinion poll data table
tbl.no <- 1
tbl <- html[(grep("<table.*",html)[tbl.no]):(grep("</table.*",html)[tbl.no])]

#Now split it into the rows, based on the <tr> tag
tbl.rows <- list()
open.tr <- grep("<tr",tbl)
close.tr <- grep("</tr",tbl)
for(i in 1:length(open.tr)) tbl.rows[[i]] <- tbl[open.tr[i]:close.tr[i]]

#Extract table headers
hdrs <- grep("<th",tbl,value=TRUE)
hdrs <- hdrs[1:(length(hdrs)/2)]
party.names <- gsub("<.*?>","",hdrs)[-c(1:2)]
party.names <- gsub(" ","_",party.names)  #Replace space with a _
party.names <- gsub("M.{1}ori","Maori",party.names)  #Apologies, but the hard "a" is too hard to handle otherwise
party.cols   <- gsub("^.*bgcolor=\"(.*?)\".*$","\\1",hdrs)[-c(1:2)]
names(party.cols) <- party.names

#Extract data rows
tbl.rows <- tbl.rows[sapply(tbl.rows,function(x) length(grep("<td",x)))>1]

#Now extract the data
survey.dat <- lapply(tbl.rows,function(x) {
  #Start by only considering where we have <td> tags
  td.tags <- x[grep("<td",x)]
  #Polling data appears in columns other than first two
  dat     <- td.tags[-c(1,2)]
  #Now strip the data and covert to numeric format
  dat     <- gsub("<td>|</td>","",dat)
  dat     <- gsub("%","",dat)
  dat     <- gsub("-","0",dat)
  dat     <- gsub("<","",dat)
  dat     <- as.numeric(dat)
  if(length(dat)!=length(party.names)) {
     stop(sprintf("Survey data is not defined properly: %s",td.tags[1]))
  }
  names(dat) <- party.names
  #Getting the date strings is a little harder. Start by tidying up the dates
  date.str <- td.tags[2]                        #Dates are in the second column
  date.str <- gsub("<sup.*</sup>","",date.str)   #Throw out anything between superscript tags, as its an reference to the source
  date.str <- gsub("<td>|</td>","",date.str)  #Throw out any tags
  #Get numeric parts of string
  digits.str <- gsub("[^0123456789]"," ",date.str)
  digits.str <- gsub("^ +","",digits.str)    #Drop leading whitespace
  digits     <- strsplit(digits.str," +")[[1]]
  yrs        <- grep("[0-9]{4}",digits,value=TRUE)
  days       <- digits[!digits%in%yrs]
  #Get months
  month.str <- gsub("[^A-Z,a-z]"," ",date.str)
  month.str <- gsub("^ +","",month.str)        #Drop leading whitespace
  mnths     <- strsplit(month.str," +",month.str)[[1]]
  #Now paste together to make standardised date strings
  days  <- rep(days,length.out=2)
  mnths <- rep(mnths,length.out=2)
  yrs <- rep(yrs,length.out=2)
  dates.std <- paste(days,mnths,yrs)
  #And finally the survey time
  survey.time <- mean(as.POSIXct(strptime(dates.std,format="%d %B %Y")))
  #Get the name of the survey company too
  survey.comp <- td.tags[1]
  survey.comp <- gsub("<sup.*</sup>","",survey.comp)
  survey.comp <- gsub("<td>|</td>","",survey.comp)
  survey.comp <- gsub("<U+2013>","-",survey.comp,fixed=TRUE)
  survey.comp <- gsub("(?U)<.*>","",survey.comp,perl=TRUE)
  survey.comp <- gsub("^ +| +$","",survey.comp)
  survey.comp <- gsub("-+"," ",survey.comp)

  #And now return results
  return(data.frame(Company=survey.comp,Date=survey.time,date.str,t(dat)))
})

#Combine results
surveys <- do.call(rbind,survey.dat)

#==========================================
#Now generate each plot
#==========================================
smoothers  <- list()
for(opt in opts) {

#Restrict data to selected parties
selected.parties <- gsub(" ","_",sort(opt$parties))
selected.cols <- party.cols[selected.parties]
plt.dat   <- surveys[,c("Company","Date",selected.parties)]
plt.dat <- subset(plt.dat,!is.na(surveys$Date))
plt.dat <- plt.dat[order(plt.dat$Date),]
plt.dat$date.num  <- as.double(plt.dat$Date)
plt.dat <- subset(plt.dat,Company!="2008 election result")
plt.dat$Company <- factor(plt.dat$Company)

#Setup plot
ticks <- ISOdate(c(rep(2011,1),rep(2012,2),rep(2013,2),rep(2014,2),2015),c(rep(c(7,1),4)),1)
xlims <- range(c(ISOdate(2011,11,1),ticks))
png(opt$fname,width=778,height=487,pointsize=16)
par(mar=c(5.5,4,1,1))
matplot(plt.dat$date.num,plt.dat[,selected.parties],pch=NA,xlim=xlims,ylab="Party support (%)",
    xlab="",col=selected.cols,xaxt="n",ylim=opt$ylims,yaxs="i")
abline(h=seq(0,95,by=5),col="lightgrey",lty=3)
abline(v=as.double(ticks),col="lightgrey",lty=3)
box()
axis(1,at=as.double(ticks),labels=format(ticks,format="1 %b\n%Y"),cex.axis=0.8)
axis(4,at=axTicks(4),labels=rep("",length(axTicks(4))))

#Now calculate the gam smoothers and add the confidence interval
smoothed.l <- list()
for(n in selected.parties) {
  smooth.dat <-  data.frame(value=plt.dat[,n],company=plt.dat$Company,date=plt.dat$date.num)
  #Smoother is a GAMM with polling company as a random effect
  #Initially, we use a fixed term smoother. Once we get some data,
  #can switch to automatic smoothness selection
  smoother <- gamm(value ~ s(date,k=10) ,data=smooth.dat,random=list(company=~1))
  smoothers[[n]] <- smoother
  smoothed <- do.call(data.frame,predict(smoother$gam,se=TRUE))
  smoothed$date <- smoother$gam$model$date
  polygon(c(smoothed$date,rev(smoothed$date)),
    c(smoothed$fit+smoothed$se.fit*1.96,rev(smoothed$fit-smoothed$se.fit*1.96)),
    col=rgb(0.5,0.5,0.5,0.5),border=NA)
  smoothed.l[[n]] <- smoothed
}

#Then add the data points
matpoints(plt.dat$date.num,plt.dat[,selected.parties],pch=20,col=selected.cols)
#And finally the smoothers themselves
for(n in selected.parties) {
  lines(smoothed.l[[n]]$date,smoothed.l[[n]]$fit,col=selected.cols[n],lwd=2)
}

n.parties <- length(selected.parties)
legend(grconvertX(0.5,"npc"),grconvertY(0.0,"ndc"),xjust=0.5,yjust=0,
       legend=gsub("_"," ",selected.parties),
       col=selected.cols,pch=20,bg="white",lwd=2,
       ncol=ifelse(n.parties>4,ceiling(n.parties/2),n.parties),xpd=NA)
#Add best estimates
fmt.str <- sprintf("%%2.%if\261%%1.%if %%%%",opt$dp,opt$dp)
for(n in names(smoothed.l)) {
  lbl <- sprintf(fmt.str,
                 round(rev(smoothed.l[[n]]$fit)[1],opt$dp),
                 round(1.96*rev(smoothed.l[[n]]$se.fit)[1],opt$dp))
  text(rev(plt.dat$date.num)[1],rev(smoothed.l[[n]]$fit)[1],
       labels=lbl,pos=4,col=selected.cols[n],xpd=NA)
}
dev.off()
}

#==========================================
#Finished!
#==========================================

cat("Complete.\n")
Llicència
Jo, el titular dels drets d'autor d'aquest treball, el public sota la següent llicència:
Aquest fitxer està subjecte a la llicència de Creative Commons Reconeixement i Compartir Igual 3.0 No adaptada.
- Sou lliure de:
- compartir – copiar, distribuir i comunicar públicament l'obra
- adaptar – fer-ne obres derivades
- Amb les condicions següents:
- reconeixement – Heu de donar la informació adequada sobre l'autor, proporcionar un enllaç a la llicència i indicar si s'han realitzat canvis. Podeu fer-ho amb qualsevol mitjà raonable, però de cap manera no suggereixi que l'autor us dóna suport o aprova l'ús que en feu.
- compartir igual – Si modifiqueu, transformeu, o generareu amb el material, haureu de distribuir les vostres contribucions sota una llicència similar o una de compatible com l'original
Historial del fitxer
Cliqueu una data/hora per veure el fitxer tal com era aleshores.
| Data/hora | Miniatura | Dimensions | Usuari/a | Comentari | |
|---|---|---|---|---|---|
| actual | 23:36, 18 set 2014 | | 778 × 487 (13 Ko) | Lcmortensen | update to 19 September, change prediction to 1dp. |
| 08:44, 17 set 2014 |  | 778 × 487 (13 Ko) | Lcmortensen | update to 17 September 2014 | |
| 01:14, 14 set 2014 |  | 778 × 487 (13 Ko) | Lcmortensen | update to 14 September release | |
| 09:07, 11 set 2014 |  | 778 × 487 (13 Ko) | Lcmortensen | update to 11 September 2014 | |
| 11:37, 5 set 2014 |  | 778 × 487 (12 Ko) | Lcmortensen | update to 5 September 2014 | |
| 11:34, 5 set 2014 |  | 778 × 487 (12 Ko) | Onco p53 | Update to 53 September 2014 | |
| 09:31, 3 set 2014 |  | 778 × 487 (12 Ko) | Lcmortensen | Update to 3 September 2014 | |
| 09:17, 31 ago 2014 |  | 778 × 487 (12 Ko) | Lcmortensen | update to 31 August 2014 | |
| 09:12, 27 ago 2014 |  | 778 × 487 (12 Ko) | Lcmortensen | update to 27 Aug 2014 | |
| 11:42, 17 ago 2014 |  | 778 × 487 (12 Ko) | Onco p53 | updated 17 August 2014 |
Ús del fitxer
La pàgina següent utilitza aquest fitxer:
Ús global del fitxer
Utilització d'aquest fitxer en altres wikis:
- Utilització a en.wikipedia.org