Fitxer:Oslo population.svg

Mida d'aquesta previsualització PNG del fitxer SVG: 600 × 480 píxels. Altres resolucions: 300 × 240 píxels | 960 × 768 píxels | 1.280 × 1.024 píxels | 2.560 × 2.048 píxels.
Fitxer original (fitxer SVG, nominalment 600 × 480 píxels, mida del fitxer: 5 Ko)
| Aquest fitxer i la informació mostrada a continuació provenen del dipòsit multimèdia lliure Wikimedia Commons. |
| Descripció |
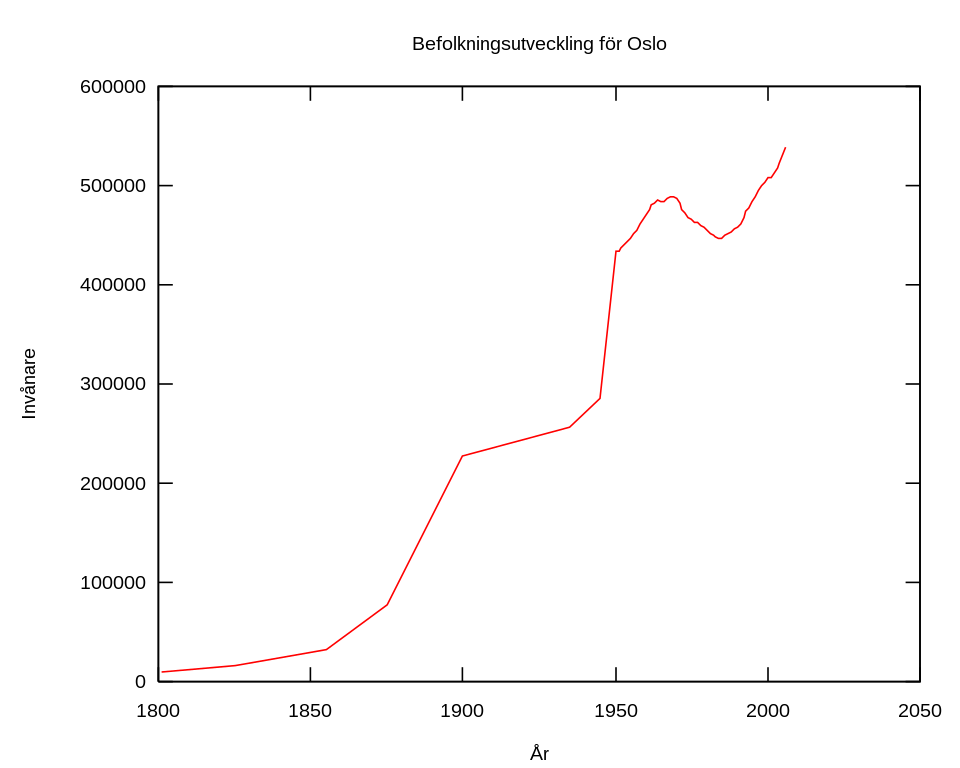
English: Population in Oslo,Norway from 1801-2006 with yearly data from 1950-2006. If anyone can fill in more detailed data before 1950 it would be great. Note that Oslo increased in area 1948, which is the reason to the sudden large increase at that year. The text is in Swedish but can easily be modified in the svg source for other languages. Svenska: Befolkning i Oslo från 1801-2006 med årlig data från 1950-2006. Det vore fint om någon hittar och kan fylla in mer detaljerad data från före år 1950. Notera att Oslo ökade sin befolkning kraftigt 1948 på grund av större areal. |
| Data | |
| Font | ssb.no |
| Autor | User:Daniel78 |
| Permís (Com reutilitzar aquest fitxer) |
Jo, el titular dels drets d'autor d'aquest treball, el public sota la següent llicència: Aquest fitxer està publicat sota la llicència de Creative Commons Reconeixement i Compartir Igual 2.5 Genèrica.
|
The graph was created using gnuplot with the following commands:
set terminal svg
set output "oslo.svg"
set encoding iso_8859_1
set xlabel "År"
set ylabel "Invånare"
set title "Befolkningsutveckling för Oslo"
set nokey
plot "oslo.dat" with lines
where the file "oslo.dat" contained the following info:
1801 9527
1825 15359
1855 31715
1875 76866
1900 227735
1935 255700
1945 286222
1950 434047
1951 434365
1952 437184
1953 440674
1954 444041
1955 447064
1956 451247
1957 455113
1958 461591
1959 465711
1960 471511
1961 475663
1962 480461
1963 482324
1964 484711
1965 483549
1966 483757
1967 487524
1968 488231
1969 488329
1970 487363
1971 481548
1972 475563
1973 472609
1974 468514
1975 465337
1976 463022
1977 462497
1978 460377
1979 457446
1980 454872
1981 452023
1982 450386
1983 448775
1984 447257
1985 447351
1986 449395
1987 451345
1988 453730
1989 456124
1990 458364
1991 461644
1992 467441
1993 473454
1994 477781
1995 483401
1996 488659
1997 494793
1998 499693
1999 502867
2000 507467
2001 508726
2002 512589
2003 517401
2004 521886
2005 529846
2006 538411
Historial del fitxer
Cliqueu una data/hora per veure el fitxer tal com era aleshores.
| Data/hora | Miniatura | Dimensions | Usuari/a | Comentari | |
|---|---|---|---|---|---|
| actual | 23:17, 25 abr 2006 | | 600 × 480 (5 Ko) | Daniel78 | {{Information| |Description=Population in Oslo from 1801-2006 (yearly data from 1950-2006) |Source=http://www.ssb.no/ |Date=2006-04-25 |Author=User:Daniel78 |Permission={{self|cc-by-sa-2.5}} |other_versions= }} |
Ús del fitxer
La pàgina següent utilitza aquest fitxer:
Ús global del fitxer
Utilització d'aquest fitxer en altres wikis:
- Utilització a ar.wikipedia.org
- Utilització a bn.wikipedia.org
- Utilització a da.wikipedia.org
- Utilització a el.wikipedia.org
- Utilització a en.wikipedia.org
- Utilització a id.wikipedia.org
- Utilització a ms.wikipedia.org
- Utilització a no.wikipedia.org
- Utilització a sv.wikipedia.org
- Utilització a vi.wikipedia.org
- Utilització a zh.wikipedia.org