Fitxer:Student t cdf.svg

Mida d'aquesta previsualització PNG del fitxer SVG: 360 × 288 píxels. Altres resolucions: 300 × 240 píxels | 600 × 480 píxels | 960 × 768 píxels | 1.280 × 1.024 píxels | 2.560 × 2.048 píxels.
Fitxer original (fitxer SVG, nominalment 360 × 288 píxels, mida del fitxer: 35 Ko)
| Aquest fitxer i la informació mostrada a continuació provenen del dipòsit multimèdia lliure Wikimedia Commons. |
Resum
| Descripció |
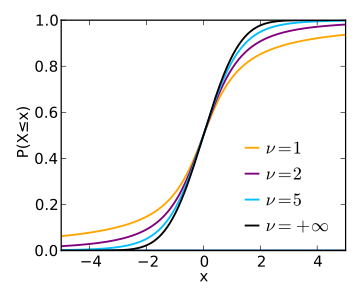
English: Plot of the cumulative distribution functions of several members of the Student t-family of probability distributions. |
| Data | |
| Font | Treball propi |
| Autor | Skbkekas |
| SVG genesis | Aquesta imatge vectorial ha estat creada amb Matplotlib |
| Codi font | Python codeimport numpy as np
import matplotlib.pyplot as plt
import scipy.special as sp
import scipy.integrate as integral
col = ['orange', 'purple', 'deepskyblue']
X = np.arange(-5, 5, 0.005)
plt.clf()
plt.figure(figsize=(4,3.2))
plt.axes([0.17,0.13,0.79,0.8])
plt.hold(True)
A = []
def PDF(x,nu):
Y = -(nu+1)*np.log(1+x**2/nu)/2
Y += sp.gammaln((nu+1)/2.0)
Y -= sp.gammaln(nu/2.0)
Y -= 0.5*np.log(nu*np.pi)
Y = np.exp(Y)
return Y
for k,nu in enumerate([1,2,5]):
Y=[]
for x in X:
Y.append(integral.quad(lambda t: PDF(t,nu),-1000,x))
a = plt.plot(X, Y, '-', color=col[k], lw=1.5)
A.append(a)
# Degenerate into Normal distribution
from scipy.stats import norm
Y = norm.cdf(X)
a = plt.plot(X, Y, '-', color='black', lw=1.5)
A.append(a)
plt.xlabel("x")
plt.ylabel(u"P(X\N{Less-THAN OR EQUAL TO}x)")
bx = plt.legend(A, (r"$\nu=1$", r"$\nu=2$", r"$\nu=5$", r"$\nu=+\infty$"),\
numpoints=1, handlelen=0.05, handletextpad=0.4,\
loc="lower right")
bx.draw_frame(False)
plt.xlim(-5,5)
plt.savefig("student_t_cdf.pdf")
plt.savefig("student_t_cdf.eps")
plt.savefig("student_t_cdf.svg")
|
Llicència
Jo, el titular dels drets d'autor d'aquest treball, el public sota la següent llicència:
Aquest fitxer està subjecte a la llicència de Creative Commons Reconeixement 3.0 No adaptada.
- Sou lliure de:
- compartir – copiar, distribuir i comunicar públicament l'obra
- adaptar – fer-ne obres derivades
- Amb les condicions següents:
- reconeixement – Heu de donar la informació adequada sobre l'autor, proporcionar un enllaç a la llicència i indicar si s'han realitzat canvis. Podeu fer-ho amb qualsevol mitjà raonable, però de cap manera no suggereixi que l'autor us dóna suport o aprova l'ús que en feu.
Historial del fitxer
Cliqueu una data/hora per veure el fitxer tal com era aleshores.
| Data/hora | Miniatura | Dimensions | Usuari/a | Comentari | |
|---|---|---|---|---|---|
| actual | 01:37, 4 abr 2014 | | 360 × 288 (35 Ko) | Hydrox | fixed colours (hand-edited SVG) |
| 09:58, 21 jul 2013 |  | 360 × 288 (35 Ko) | IkamusumeFan | Adjust the axis for better display. | |
| 09:51, 21 jul 2013 |  | 360 × 288 (35 Ko) | IkamusumeFan | 1. Using \nu instead of df, which appears in Scipy's documentation; 2. Since for some operating systems and Python versions, Scipy's stdtr function has visible errors around t=+1 and -1, we adjust the computation of CDF according to the integral defini... | |
| 17:42, 4 març 2010 |  | 360 × 288 (28 Ko) | Skbkekas | Changed df's to give better spacing, used thinner lines. | |
| 06:11, 23 feb 2010 |  | 360 × 288 (27 Ko) | Skbkekas | {{Information |Description={{en|1=Plot of the cumulative distribution functions of several members of the Student t-family of probability distributions.}} |Source={{own}} |Author=Skbkekas |Date=2010-02-22 |Permission= |other_versions= }} |
Ús del fitxer
La pàgina següent utilitza aquest fitxer:
Ús global del fitxer
Utilització d'aquest fitxer en altres wikis:
- Utilització a be.wikipedia.org
- Utilització a en.wikipedia.org
- Utilització a en.wikibooks.org
- Utilització a fi.wikipedia.org
- Utilització a it.wikipedia.org
- Utilització a ja.wikipedia.org
- Utilització a jv.wikipedia.org
- Utilització a ko.wikipedia.org
- Utilització a simple.wikipedia.org
- Utilització a sq.wikipedia.org
- Utilització a sr.wikipedia.org
- Utilització a tl.wikipedia.org