Fitxer:Anscombe.svg

Fitxer original (fitxer SVG, nominalment 945 × 630 píxels, mida del fitxer: 57 Ko)
| Aquest fitxer i la informació mostrada a continuació provenen del dipòsit multimèdia lliure Wikimedia Commons. |
Resum
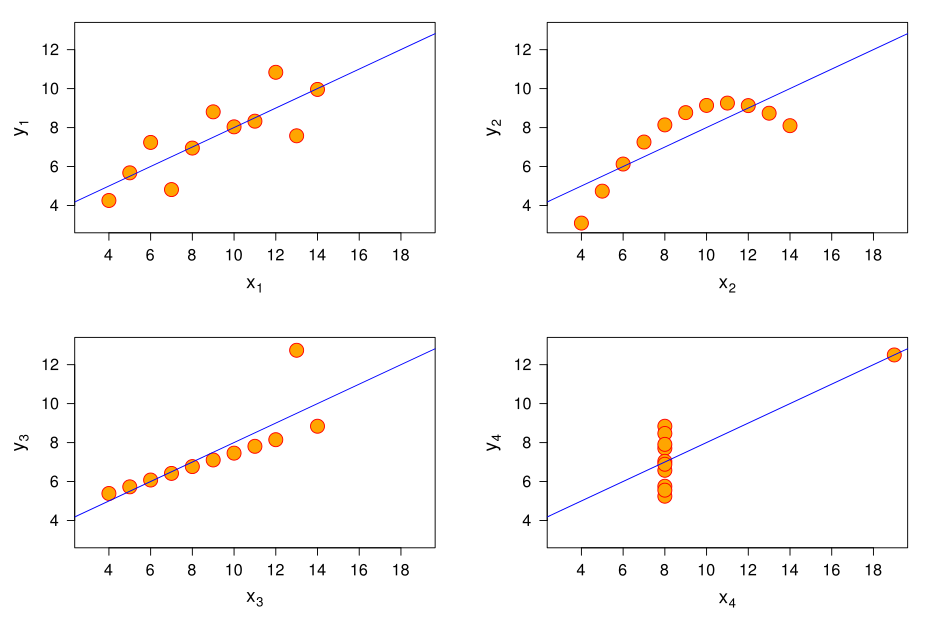
This graphic represents the four datasets defined by Francis Anscombe for which some of the usual statistical properties (mean, variance, correlation and regression line) are the same, even though the datasets are different.
| Property | Value |
|---|---|
| Mean of each variable | 9.0 |
| Variance of each variable | 11.0 |
| Mean of each variable | 7.5 |
| Variance of each variable | 4.12 |
| Correlation between each and variable | 0.816 |
| Regression line |


The graph was created by User:Schutz for Wikipedia on 13 June 2006 (and updated on 29 March 2010), using the R statistical project. The program that generated the graphic is given below; it is based on the example provided with the help page of the R dataset anscombe (accessible using the command data(anscombe); help and more information about the dataset is available using the command help(anscombe)), and was slightly modified to improve the result. The graph was directly exported in SVG format.
References:
- Anscombe, Francis J. (1973) Graphs in statistical analysis. American Statistician, 27, 17–21.
- R Development Core Team. R: A Language and Environment for Statistical Computing. R Foundation for Statistical Computing. Vienna, Austria. 2006. ISBN 3-900051-07-0. http://www.R-project.org
 svg("anscombe.svg", width=10.5, height=7)
 par(las=1)

 ##-- some "magic" to do the 4 regressions in a loop:
 ff <- y ~ x
 for(i in 1:4) {
   ff[2:3] <- lapply(paste(c("y","x"), i, sep=""), as.name)
   ## or   ff2 <- as.name(paste("y", i, sep=""))
   ##      ff3 <- as.name(paste("x", i, sep=""))
   assign(paste("lm.",i,sep=""), lmi <- lm(ff, data= anscombe))
 }

 ## Now, do what you should have done in the first place: PLOTS
 op <- par(mfrow=c(2,2), mar=1.5+c(4,3.5,0,1), oma=c(0,0,0,0),
           lab=c(6,6,7), cex.lab=1.5, cex.axis=1.3, mgp=c(3,1,0))
 for(i in 1:4) {
   ff[2:3] <- lapply(paste(c("y","x"), i, sep=""), as.name)
   plot(ff, data =anscombe, col="red", pch=21, bg = "orange", cex = 2.5,
        xlim=c(3,19), ylim=c(3,13),
        xlab=eval(substitute(expression(x[i]), list(i=i))),
        ylab=eval(substitute(expression(y[i]), list(i=i))))
   abline(get(paste("lm.",i,sep="")), col="blue")
 }

 dev.off()
Llicència
The R project is licensed under the GPL [1]; since this image is a derived work of an example script provided with R, it is also licenced under the GPL.
However, all modifications made by User:Schutz are also licensed under the CC-BY-SA licence.

|
Aquest treball és programari lliure. Podeu redistribuir-lo i modificar-lo sota els termes de la Llicència Pública General GNU (GNU GPL), publicada per la Free Software Foundation; en la seva versió número 2 o en qualsevol posterior. Aquesta obra es distribueix sota l'esperança que sigui d'utilitat, però sense cap mena de garantia, fins i tot sense la garantia implícita de comercialització o d'adequació per a un propòsit particular. Vegeu els texts de la versió 2 i de la versió 3 de la GNU GPL per a més detalls. |
Derivative works
Derivative works of this file:
Historial del fitxer
Cliqueu una data/hora per veure el fitxer tal com era aleshores.
| Data/hora | Miniatura | Dimensions | Usuari/a | Comentari | |
|---|---|---|---|---|---|
| actual | 17:10, 29 març 2010 | | 945 × 630 (57 Ko) | Schutz | |
| 02:07, 15 gen 2007 |  | 990 × 677 (88 Ko) | Schutz | ||
| 02:05, 15 gen 2007 |  | 990 × 677 (88 Ko) | Schutz | ||
| 23:37, 13 juny 2006 |  | 1.044 × 750 (94 Ko) | Schutz | ||
| 20:27, 13 juny 2006 |  | 1.125 × 875 (94 Ko) | Schutz |
Ús del fitxer
La pàgina següent utilitza aquest fitxer:
Ús global del fitxer
Utilització d'aquest fitxer en altres wikis:
- Utilització a da.wikipedia.org
- Utilització a en.wikipedia.org
- Utilització a es.wikipedia.org
- Utilització a eu.wikipedia.org
- Utilització a fi.wikipedia.org
- Utilització a fr.wikipedia.org
- Utilització a fr.wikiversity.org
- Utilització a he.wikibooks.org
- Utilització a hu.wikipedia.org
- Utilització a nl.wikipedia.org
- Utilització a nl.wiktionary.org
- Utilització a nn.wikipedia.org
- Utilització a no.wikipedia.org
- Utilització a ru.wikipedia.org
- Utilització a su.wikipedia.org
- Utilització a tr.wikipedia.org
- Utilització a uk.wikipedia.org
- Utilització a www.wikidata.org