Fitxer:Beta distribution pdf.svg

Mida d'aquesta previsualització PNG del fitxer SVG: 531 × 425 píxels. Altres resolucions: 300 × 240 píxels | 600 × 480 píxels | 960 × 768 píxels | 1.280 × 1.024 píxels | 2.559 × 2.048 píxels.
Fitxer original (fitxer SVG, nominalment 531 × 425 píxels, mida del fitxer: 80 Ko)
| Aquest fitxer i la informació mostrada a continuació provenen del dipòsit multimèdia lliure Wikimedia Commons. |
Resum
| Descripció |
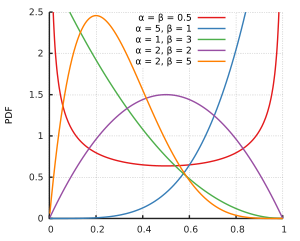
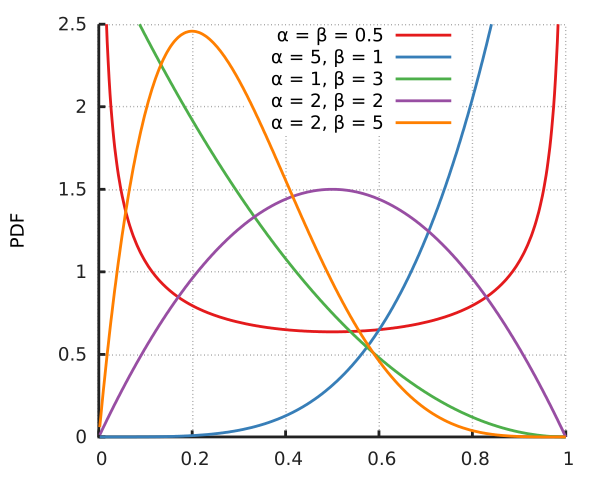
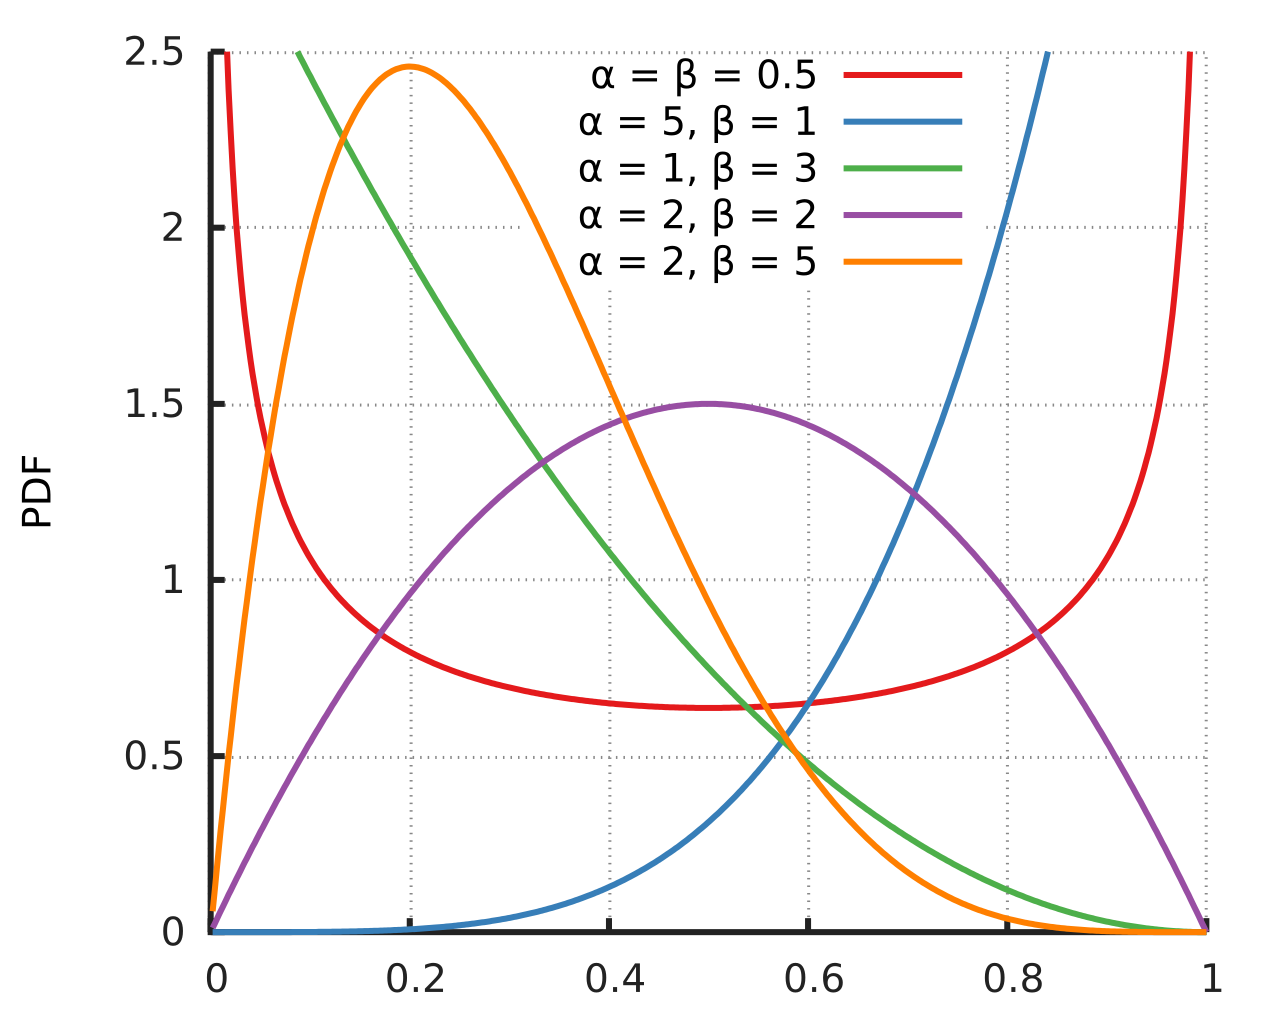
English: Probability density function for the Beta distribution. Created using Gnuplot. |
||||
| Data | |||||
| Font | Treball propi | ||||
| Autor | Horas based on the work of Krishnavedala | ||||
| Altres versions | File:Beta_distribution_pdf.png | ||||
| SVG genesis | |||||
| Codi font | Gnuplot code
Data
|
Llicència
| Aquesta imatge no és apta per tenir drets d'autor perquè consta totalment d'informació que és propietat comuna i no conté cap creació original. Per tant, és en el domini públic. |
Historial del fitxer
Cliqueu una data/hora per veure el fitxer tal com era aleshores.
| Data/hora | Miniatura | Dimensions | Usuari/a | Comentari | |
|---|---|---|---|---|---|
| actual | 15:10, 14 nov 2014 | | 531 × 425 (80 Ko) | Horas | {{Information |Description={{en|1=Probability density function for the Beta distribution. Created using the following code: reset reset session out=2 outputpath= "./" outputfilename="betadistribution" if(out==1) {... |
| 23:45, 4 juny 2011 |  | 639 × 489 (68 Ko) | Krishnavedala | {{Information |Description ={{en|1=Probability density function for the Beta distribution. Created using python with matplotlib, scipy and numpy toolboxes. <syntaxhighlight lang=" |
Ús del fitxer
La pàgina següent utilitza aquest fitxer:
Ús global del fitxer
Utilització d'aquest fitxer en altres wikis:
- Utilització a be.wikipedia.org
- Utilització a de.wikipedia.org
- Utilització a en.wikipedia.org
- Utilització a en.wikibooks.org
- Utilització a en.wiktionary.org
- Utilització a fi.wikipedia.org
- Utilització a he.wikipedia.org
- Utilització a it.wikipedia.org
- Utilització a ja.wikipedia.org
- Utilització a ko.wikipedia.org
- Utilització a pt.wikipedia.org
- Utilització a tl.wikipedia.org
- Utilització a tr.wikipedia.org
- Utilització a uk.wikipedia.org
- Utilització a zh.wikipedia.org