Fitxer:ShockleyQueisserVOC.svg

Mida d'aquesta previsualització PNG del fitxer SVG: 608 × 600 píxels. Altres resolucions: 243 × 240 píxels | 487 × 480 píxels | 778 × 768 píxels | 1.038 × 1.024 píxels | 2.076 × 2.048 píxels | 742 × 732 píxels.
Fitxer original (fitxer SVG, nominalment 742 × 732 píxels, mida del fitxer: 27 Ko)
| Aquest fitxer i la informació mostrada a continuació provenen del dipòsit multimèdia lliure Wikimedia Commons. |
Resum
| Descripció |
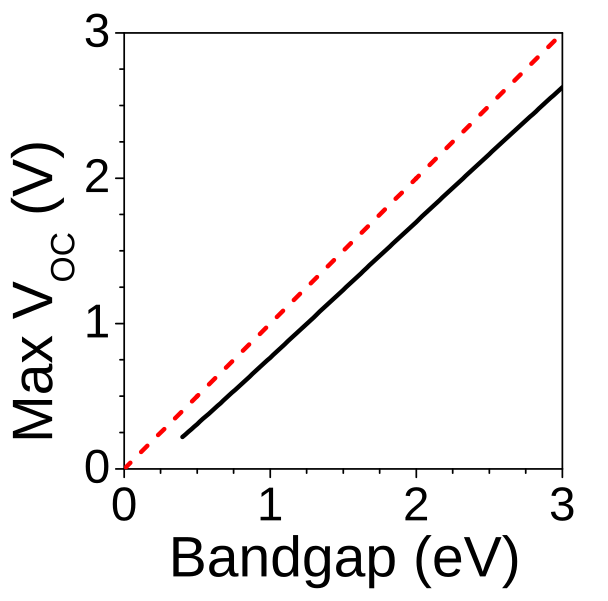
English: Black curve: The limit for the maximum open-circuit current of a solar cell within the Shockley-Queisser model. The x-axis is the bandgap of the solar cell in electron volts, the y-axis is the highest possible open-circuit voltage in volts. The red dotted line is "y=x", showing that the open-circuit voltage is always somewhat smaller than the bandgap voltage. (The model assumes a single-junction solar cell under unconcentrated light, and some other assumptions too. I used the AM1.5G solar spectrum data for the calculation.) I cross-checked my curve with an independently-calculated one and they agree to high accuracy, see Practical Handbook of Photovoltaics p129.
Русский: Черная линия — предел максимального напряжения холостого хода солнечного элемента в модели Шокли — Кейсера. По оси X отложена запрещенная зона солнечного элемента в электрон-вольтах, по оси Y — максимально возможное напряжение холостого хода в вольтах. Красная пунктирная линия — «y=x», проведена для иллюстрации, что напряжение холостого хода всегда несколько меньше напряжения запрещенной зоны. |
| Data | |
| Font | Treball propi |
| Autor | Sbyrnes321 |
| Altres versions |
|


I did the calculation in Mathematica, plotted it in Origin, and did PDF-->SVG conversion in Inkscape. Then a few years later, I ported the code from Mathematica to Python, and you can now see the whole calculation and results at https://github.com/sbyrnes321/SolarCellEfficiencyLimits/blob/master/sq.ipynb
Llicència
| Jo, el titular del copyright d'aquesta obra, l'allibero al domini públic. Això s'aplica a tot el món. En alguns països això pot no ser legalment possible, en tal cas: Jo faig concessió a tothom del dret d'usar aquesta obra per a qualsevol propòsit, sense cap condició llevat d'aquelles requerides per la llei. |
Historial del fitxer
Cliqueu una data/hora per veure el fitxer tal com era aleshores.
| Data/hora | Miniatura | Dimensions | Usuari/a | Comentari | |
|---|---|---|---|---|---|
| actual | 10:30, 9 feb 2011 | | 742 × 732 (27 Ko) | Sbyrnes321 | {{Information |Description ={{en|1=Black curve: The limit for the maximum open-circuit current of a solar cell within the Shockley-Queisser model. The x-axis is the bandgap of the solar cell in electron volts, the y-axis is the highest possible open-ci |
Ús del fitxer
La pàgina següent utilitza aquest fitxer:
Ús global del fitxer
Utilització d'aquest fitxer en altres wikis:
- Utilització a ar.wikipedia.org
- Utilització a en.wikipedia.org
- Utilització a es.wikipedia.org
- Utilització a ja.wikipedia.org
- Utilització a pt.wikipedia.org