Fitxer:Voltage regulator foldback.svg

Mida d'aquesta previsualització PNG del fitxer SVG: 278 × 276 píxels. Altres resolucions: 242 × 240 píxels | 483 × 480 píxels | 774 × 768 píxels | 1.031 × 1.024 píxels | 2.063 × 2.048 píxels.
Fitxer original (fitxer SVG, nominalment 278 × 276 píxels, mida del fitxer: 45 Ko)
| Aquest fitxer i la informació mostrada a continuació provenen del dipòsit multimèdia lliure Wikimedia Commons. |
Resum
| Descripció |
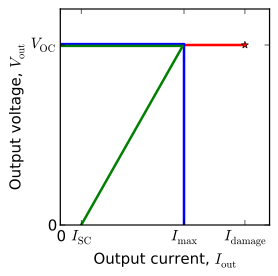
English: Voltage regulator V-I curves for foldback, current limited, and unlimited. |
| Data | |
| Font | Treball propi |
| Autor | Nanite |
| SVG genesis | El codi font d’aquest SVG no és vàlid perquè hi ha un error. Aquesta imatge vectorial ha estat creada amb Matplotlib |
| Codi font | Python code#Requires [[:wikipedia:matplotlib|matplotlib]]. Due to a bug in wikipedia's SVG renderer,
#the raw files appear with curves peeking outside of the axes.
#Before uploading the files were touched up by releasing and re-setting the clip paths.
from pylab import *
figtype = '.svg'
saveopts = {'bbox_inches':'tight'} #, 'transparent':True, 'frameon':True}
seterr(divide='ignore')
V_fb = concatenate([linspace(9.95,9.95,100, endpoint=False), linspace(9.95,0,101)])
I_fb = concatenate([linspace(0,0.995,100, endpoint=False), linspace(0.995,0.17,101)])
V_cl = concatenate([linspace(10.05,10.05,100, endpoint=False), linspace(10.05,0,101)])
I_cl = concatenate([linspace(0,1.005,100, endpoint=False), linspace(1.005,1.005,101)])
V_nl = linspace(10,10,151)
I_nl = linspace(0,1.5,151)
# Compute powers; Assume regulator is dropping voltage from a source 20% higher than V_oc.
P_cl = I_cl*(V_cl[0]*1.2 - V_cl)
P_fb = I_fb*(V_fb[0]*1.2 - V_fb)
P_nl = I_nl*(V_nl[0]*1.2 - V_nl)
Gcrit = 0.1
Rcrit = 10
Pcrit = 2
### Make V-I curve plot
fig = figure()
ax = axes()
xlim(0,1.7)
ylim(0,12)
ax.set_xlabel('Output current, $I_{\\rm out}$')
ax.set_xticks([I_fb[0], I_fb[-1], max(I_cl), max(I_nl)])
ax.set_xticklabels(['0', '$I_{\\rm SC}$', '$I_{\\rm max}$', '$I_{\\rm damage}$'])
ax.set_ylabel('Output voltage, $V_{\\rm out}$')
ax.set_yticks([0,10])
ax.set_yticklabels(['0', '$V_{\\rm OC}$'])
ax.plot(I_nl, V_nl, 'r', linewidth=2)
ax.plot([I_nl[-1]], [V_nl[-1]], 'r*', linewidth=2)
ax.plot(I_cl, V_cl, 'b', linewidth=2)
ax.plot(I_fb, V_fb, 'g', linewidth=2)
fig.set_size_inches(3,3)
fig.patch.set_alpha(0)
savefig('foldback-vi'+figtype, **saveopts)
### Make power and resistance load plot
fig = figure()
ax = axes()
xlim(0,0.5)
ylim(0,13)
ax.set_xlabel('Load conductance ($\Omega^{-1}$)')
#ax.set_xticks([0,0.1])
#ax.set_xticklabels(['0', '$G_{\\rm crit}$'])
ax.set_ylabel('Regulator heating power (W)')
ax.set_yticks([0,
round(P_fb[100],1),
round(max(P_fb),1),
round(P_fb[-1],1),
round(P_cl[-1],1)])
#ax.set_yticklabels(['0', '$P_{\\rm max,FB}$', '$P_{\\rm SC,FB}$','$P_{\\rm SC,CL}$'])
# Plot heat in regulator vs. conductance
ax.axvline(Gcrit, color='#777777', linestyle='dashed', linewidth=0.5)
ax.axhline(P_fb[-1], color='#777777', linestyle='dashed', linewidth=0.5)
ax.axhline(P_cl[-1], color='#777777', linestyle='dashed', linewidth=0.5)
ax.plot(I_nl/V_nl, P_nl, 'r', linewidth=2)
ax.plot([(I_nl/V_nl)[-1]], [P_nl[-1]], 'r*', linewidth=2)
ax.plot(I_cl/V_cl, P_cl, 'b', linewidth=2)
ax.plot(I_fb/V_fb, P_fb, 'g', linewidth=2)
ax.text(Gcrit/2, 9, 'OK', horizontalalignment='center')
ax.text(0.3, 9, 'Overload', horizontalalignment='center')
fig.set_size_inches(3,3)
fig.patch.set_alpha(0)
savefig('foldback-loadcon'+figtype, **saveopts)
### Make power and conductance load plot
fig = figure()
ax = axes()
xlim(0,16)
ylim(0,13)
ax.set_xlabel('Load resistance ($\Omega$)')
ax.set_xticks([0,5,10,15])
#ax.set_xticklabels(['0', '$G_{\\rm crit}$'])
ax.set_ylabel('Dissipation in regulator (W)')
#ax.set_yticks([0,
# round(P_fb[100],1),
# round(max(P_fb),1),
# round(P_fb[-1],1),
# round(P_cl[-1],1)])
#ax.set_yticklabels(['0', '$P_{\\rm max,FB}$', '$P_{\\rm SC,FB}$','$P_{\\rm SC,CL}$'])
# Plot heat in regulator vs. resistance
amfb = argmax(P_fb)
# grey lines
ax.axvline(Rcrit, color='#777777', linestyle='dashed', linewidth=0.5)
ax.plot([0,V_fb[amfb]/I_fb[amfb]], [P_fb[amfb]]*2, color='#777777', linestyle='dashed', linewidth=0.5)
ax.plot([0,Rcrit],[Pcrit,Pcrit], color='#777777', linestyle='dashed', linewidth=0.5)
#curves
ax.plot(V_nl/I_nl, P_nl, 'r', linewidth=2)
ax.plot([(V_nl/I_nl)[-1]], [P_nl[-1]], 'r*', linewidth=2)
ax.plot(V_cl/I_cl, P_cl, 'b', linewidth=2)
ax.plot(V_fb/I_fb, P_fb, 'g', linewidth=2)
ax.text(Rcrit/2, 12, 'Overloaded', horizontalalignment='center')
ax.text(13, 12, 'Normal', horizontalalignment='center')
fig.set_size_inches(3,3)
fig.patch.set_alpha(0)
savefig('foldback-loadres'+figtype, **saveopts)
|
Llicència
Jo, el titular dels drets d'autor d'aquest treball, el public sota la següent llicència:
| L'ús d'aquest fitxer és regulat sota les condicions de Creative Commons de CC0 1.0 lliurament al domini públic universal. | |
| La persona que ha associat un treball amb aquest document ha dedicat l'obra domini públic, renunciant en tot el món a tots els seus drets de d'autor i a tots els drets legals relacionats que tenia en l'obra, en la mesura permesa per la llei. Podeu copiar, modificar, distribuir i modificar l'obra, fins i tot amb fins comercials, tot sense demanar permís.
|
Historial del fitxer
Cliqueu una data/hora per veure el fitxer tal com era aleshores.
| Data/hora | Miniatura | Dimensions | Usuari/a | Comentari | |
|---|---|---|---|---|---|
| actual | 08:41, 2 ago 2013 | | 278 × 276 (45 Ko) | Nanite | labels, transparency |
| 16:17, 1 ago 2013 |  | 278 × 274 (25 Ko) | Nanite | User created page with UploadWizard |
Ús del fitxer
La pàgina següent utilitza aquest fitxer:
Ús global del fitxer
Utilització d'aquest fitxer en altres wikis:
- Utilització a en.wikipedia.org
- Utilització a fa.wikipedia.org
- Utilització a it.wikibooks.org